1.3 Using R
The following examples and exercises should give you a first look at what R does and how it works.
R is a command-line program, which just means commands are entered line-by-line at the prompt. Being a programming language it is very finicky. Everything has to be entered just right - including case-sensitivity.
There are two ways of entering commands: Either typing them out carefully into the “Console” (the lower-left window in Rstudio) and hitting Enter. The alternative approach is to write and edit lines in the script editor (upper-left window in Rstudio), and passing the code into the console by hitting Ctrl-Enter (Cmd-Enter on Mac) or clicking the Run button.
For the most part, we will be only doing single commands and the command window is sufficient. But in general, it is smarter to do all of your coding in a script window, and then save the raw code file as a text document, which you can revisit and re-run at any point later.
1.3.1 R as a Calculator
R can do everything a calculator can do (and more). Addition +, subtraction -, multiplication *, division /, raising to a power ^, and many others.
1 + 2## [1] 33 * 4## [1] 122 ^ 8## [1] 2562 * (3 + 4) ^ 3## [1] 686and so on.
1.3.2 Assigning Variables
R can store numbers (and many other things) in placeholders called variables.
The assignment operator is <- (preferred) or =. It’s supposed to look like an arrow pointing left. We assign the value 5 to the variable X.
X <- 5Notice that using the assignment operator sets the value of X but doesn’t print any output. To see what value X contains, you need to type:
X## [1] 5Notice also that X now appears in the upper-right panel of Rstudio, letting you know that there is now an object in memory called X.
Now you can use X as if it were a number:
X * 2## [1] 10X ^ X## [1] 3125Note that you can name a variable anything, as long as it starts with a character.
Fred <- 5
Nancy <- Fred * 2
Fred + Nancy
## [1] 151.3.3 Rounding
The round() function is useful for rounding answers numbers to a specific number of decimal places.
x <- sqrt(0.5)
x
## [1] 0.7071068round(x, 2)## [1] 0.71round(x, 3)## [1] 0.7071.3.4 Vectors
Another simple object in R is called a vector, which is a collection of numbers. The function c() (which stands for “concatenate”) is useful for creating vectors:
c(3, 8, 5)## [1] 3 8 5We can also easily create sequences of numbers:
4:10## [1] 4 5 6 7 8 9 10Variables can contain vectors:
X <- c(3, 8, 5, 4, 9)We can access a particular element in a vector with [].
X[3]## [1] 5Now, let’s do some arithmetic with this vector:
X + 1## [1] 4 9 6 5 10X * 2## [1] 6 16 10 8 18X ^ 2## [1] 9 64 25 16 81Note that in all of these cases, the arithmetic operations are performed on a term-by-term basis.
You can also make a vector of text called character strings:
Names <- c("Alice", "Boris", "Chaozhi", "Diego", "Eliza")
Names
## [1] "Alice" "Boris" "Chaozhi" "Diego" "Eliza"Now that we have some data, we can study them with simple functions:
sum(X)## [1] 29length(X)## [1] 5mean(X)## [1] 5.8Note that if you try to do something mathematical with characters, you get an error.
sum(Names)## Error in sum(Names): invalid 'type' (character) of argument1.3.5 Plotting
It is easy (but not very interesting) to plot the Data:
plot(X)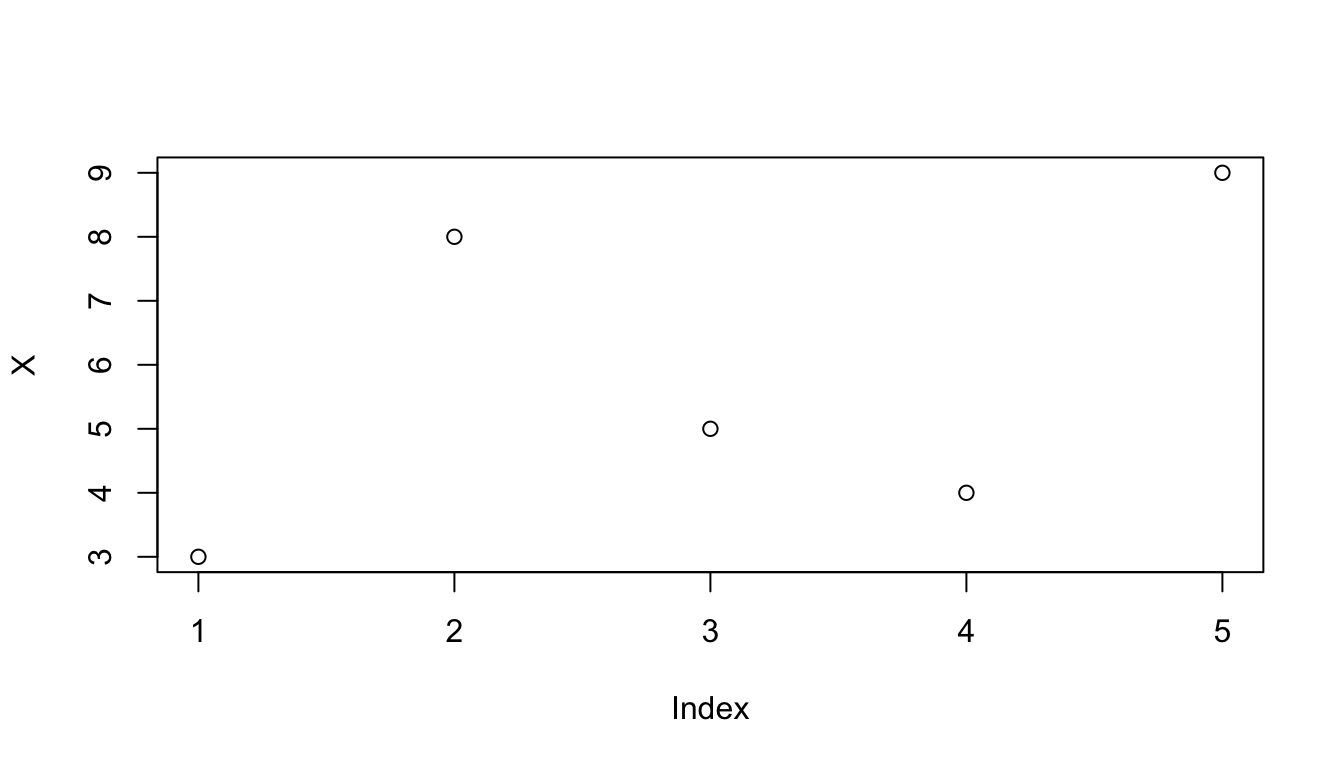
Notice that the figure appears in the lower right panel of the RStudio screen. Try using the “Zoom” command in the Plot tab command bar.
A “barplot” might be a little nicer:
barplot(X)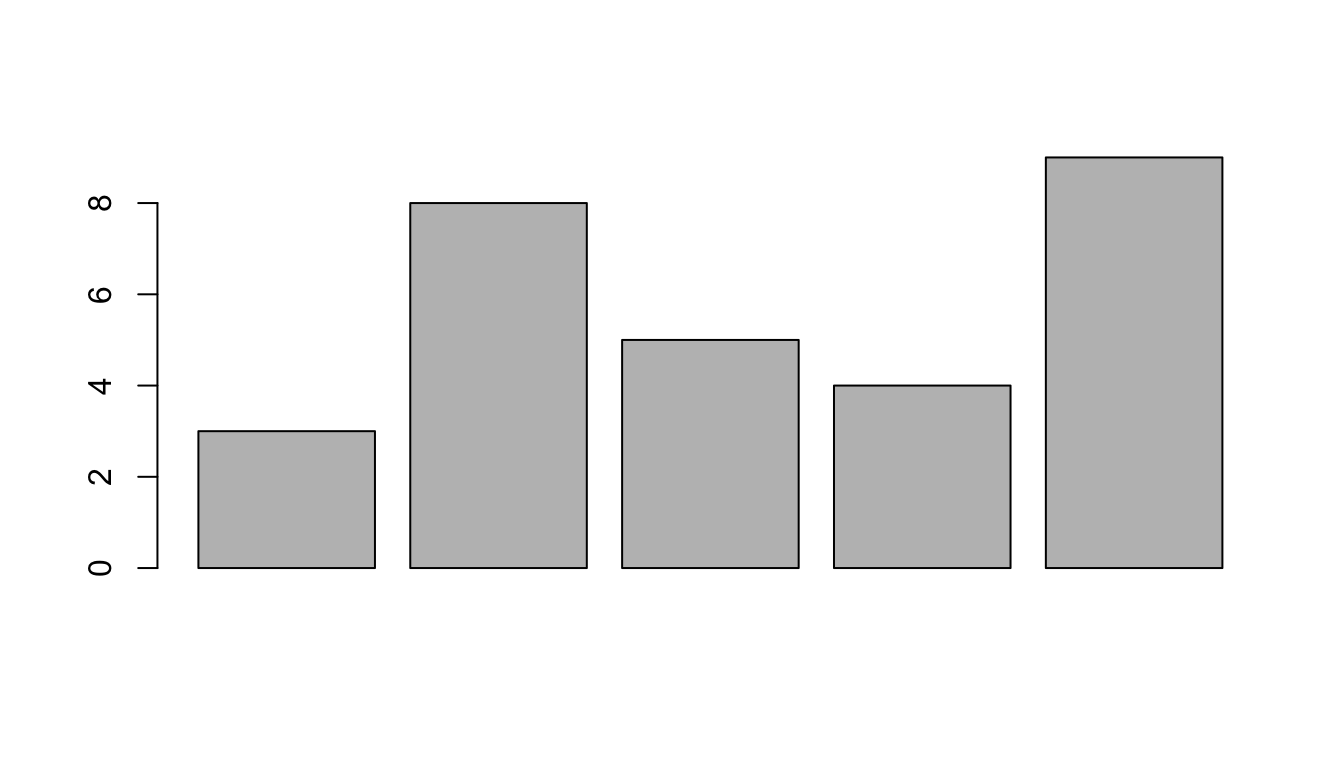
And we can give labels to the barplot by adding a names argument (note, that “argument” refers to any information that you give to a function).
barplot(X, names = Names)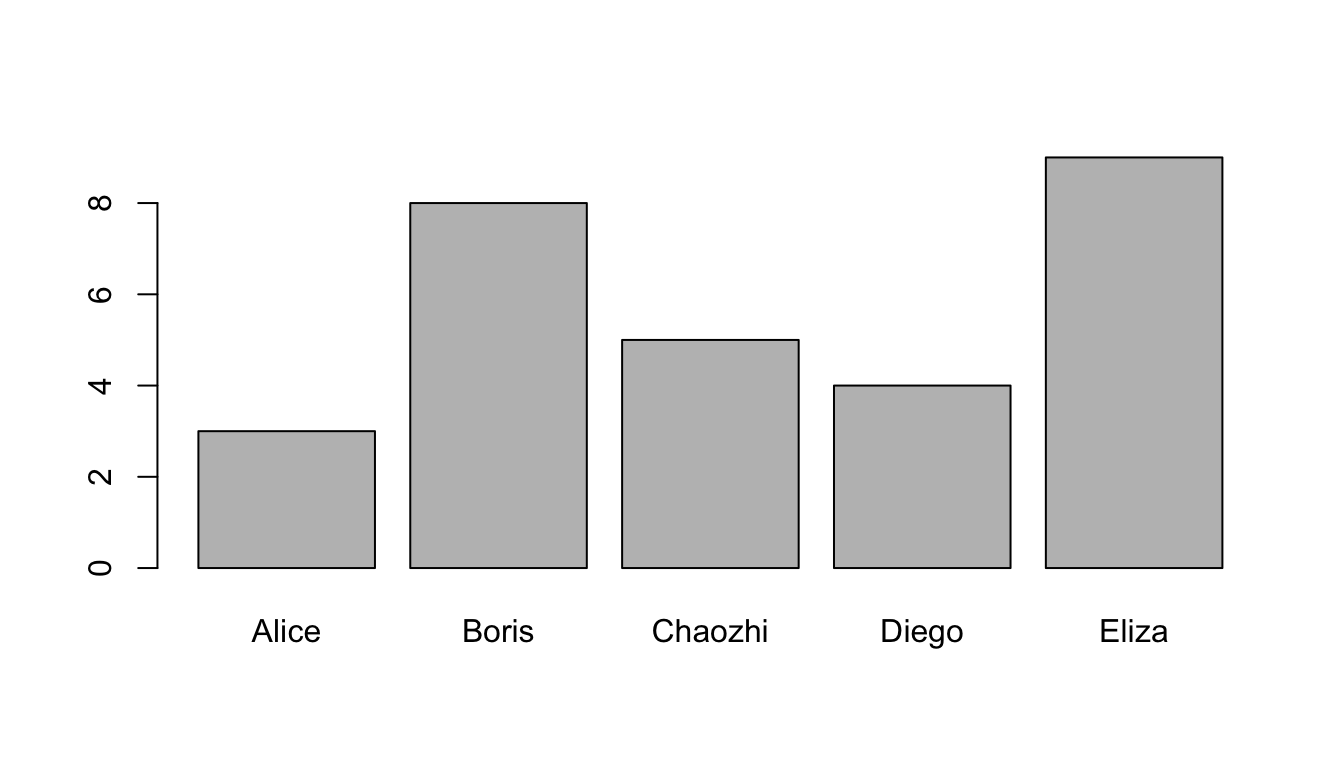
Note that you can export the image using the Export button in the Plot command bar.
Here’s a pie chart:
pie(X, labels = Names)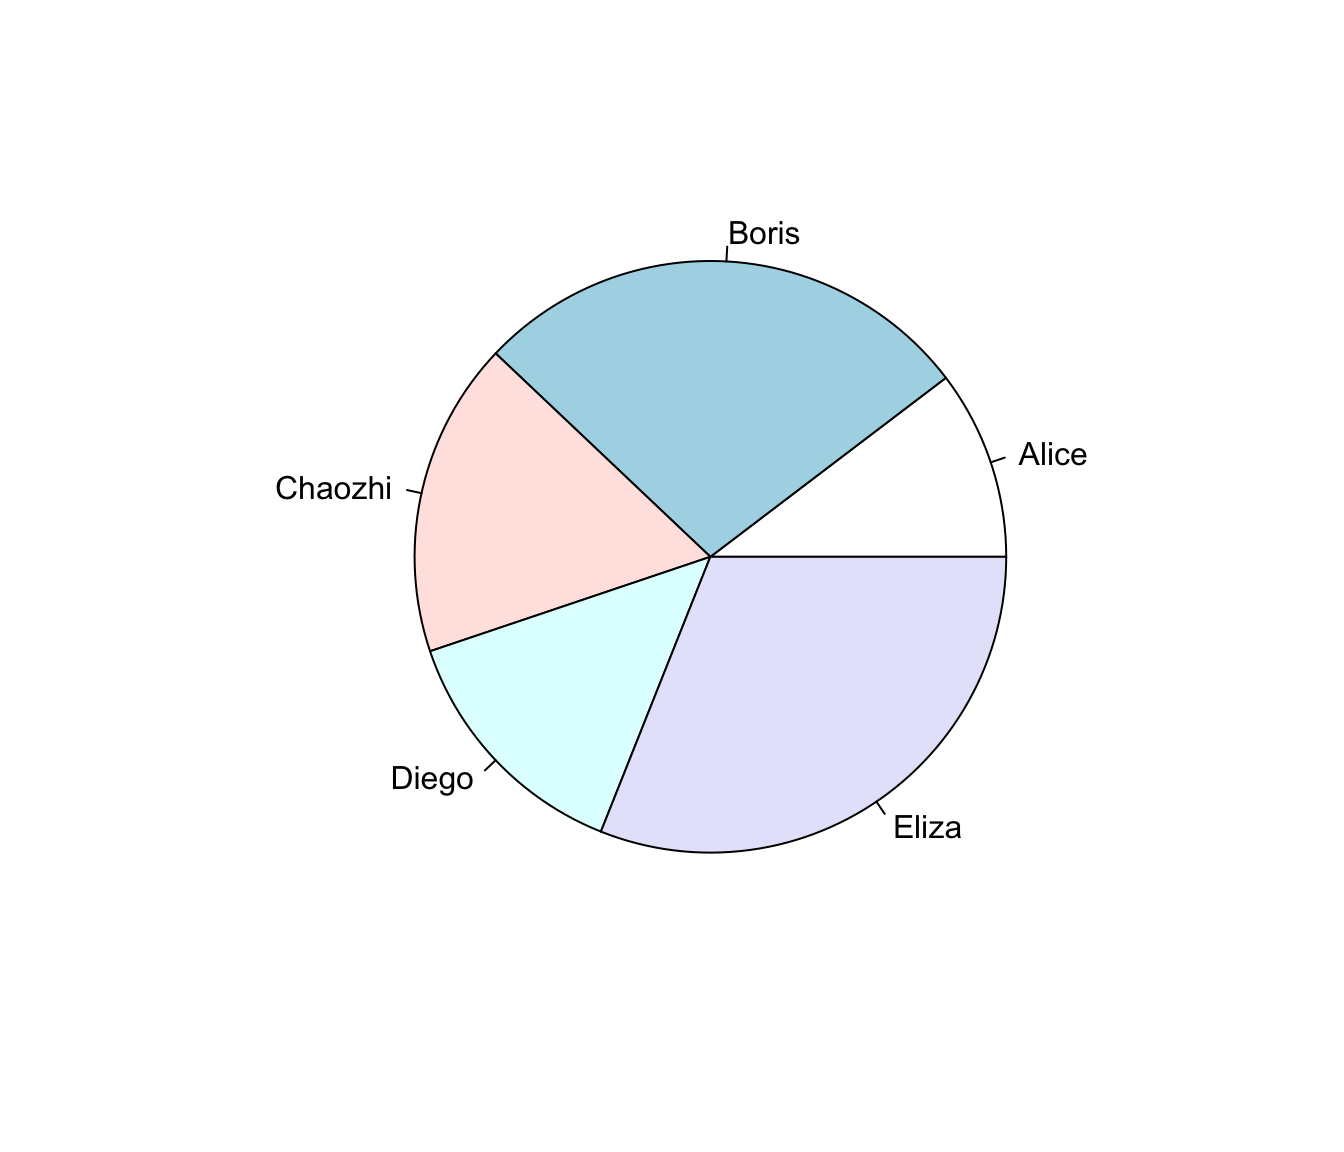
Note that in barplot() the label argument is names, but in pie() the labeling is labels. Why, and how can we know? We check the help files (via ? or help()) or search online.
1.3.6 Exercises
- Make a vector called
Datathat contains, in order, the number of students sitting in your row, the number of people living in your house/apartment/dorm suite, the number of pets you have ever had, your age, and your shoesize. Make another vector calledNames, which contains short names for each of these numbers.
Example code:
Data <- c(1,2,8,36,9)
Names <- c("Students", "Roomies", "Pets", "Age", "Shoesize")
Create an object called
Nwhich is the length of yourData, and use that object with thesum()function to calculate the arithmetic mean of your data. Try applying themean()function toData. Does it agree with your calculation above?The International Rhino Federation estimates that there 17,800 rhinoceroses (Rhinocerotidae spp.) living in the wild in Africa and Asia. Make a barplot and pie chart of these data.
Example code:
Species <- c("Black", "White", "Sumatran", "Javan", "Indian")
Population <- c(3610, 11330, 300, 60, 2500)
Rhino <- data.frame(Species, Population)| Species | Population | |
|---|---|---|
| 1 | Black | 3610 |
| 2 | White | 11330 |
| 3 | Sumatran | 300 |
| 4 | Javan | 60 |
| 5 | Indian | 2500 |