9.2 Simple Linear Regression
Learning Objectives
- Review numerical summaries
- Review linear regression
- Review reverse regression
Useful Functions
- Use
mean()to calculate sample means. - Use
sd()to calculate sample standard deviations. - Use
round()to round your answers. - Use
lm()to fit linear models, unless instructed otherwise.
Dataset: Shark Pups
For this question, use the similar shark pup data that we used in section earlier, slightly altered for the purposes of this lab assignment. Download the dataset or copy the dataset’s URL here: pups_lab2.csv. For the lab you will focus on the regression of Y = length on X = age.
Note: This code as written will only work if you download the dataset to your working directory. You can also replace pups_lab2.csv with the URL above.
pupdata <- readr::read_csv("pups_lab2.csv")
pupage <- pupdata$age
puplength <- pupdata$length
Let’s examine the scatterplot of the two variables:
plot(puplength ~ pupage,
     main = "Pup length vs pup age", xlab = "Age", ylab = "Length",
     pch = 16, col = rgb(0, 0, 0, 0.5))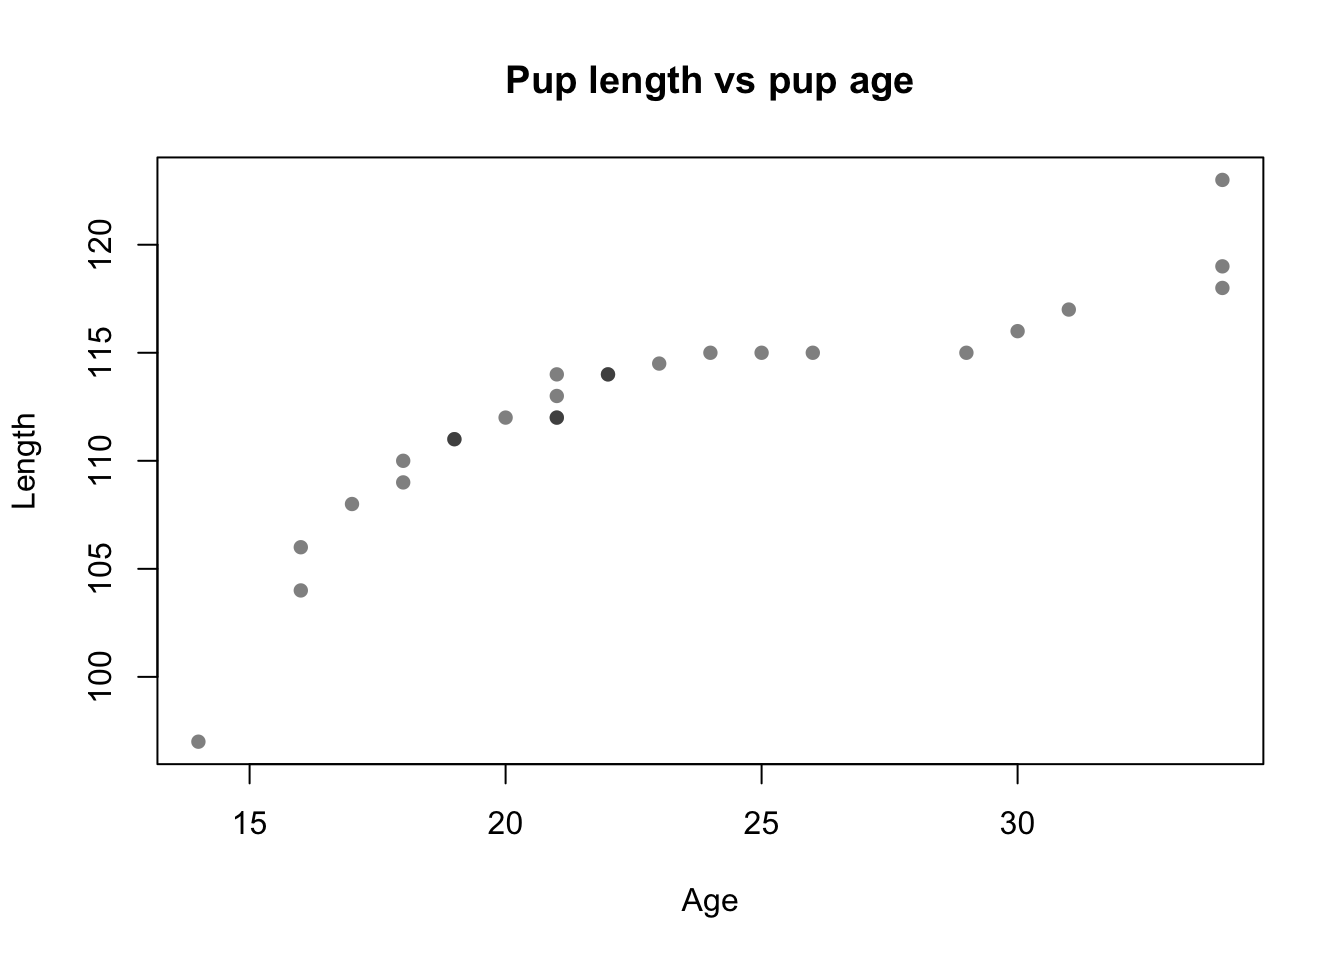
Note that this exercise is very similar to the self-guided portion of the lab, but now we take length instead of weight to be our response variable \(Y\).
Report your answers rounded to 2 decimal places. You can optionally use round(value,2). Note that if an answer requires you to use a value from a previous part, do not use rounded values in computations. For example, if a value is 10.1692, report 10.17, but use 10.1692 in any further computations.
9.2.1 Summary Statistics
What is the sample mean of pup length?
What is the sample mean of pup age?
What is the sample standard deviation of pup length?
What is the sample standard deviation of pup age?
What is the sample correlation of pup length and age?
9.2.2 Computing the Regression Line
First compute all the \((X_i - \bar{X})\) and \((Y_i - \bar{Y})\) terms. Multiplying these two terms, and summing the product will get the numerator for \(\hat{b}\), while squaring the first term and summing it will get the denominator. Execute the following command:
centerAge <- pupage - mean(pupage)
centerLength <- puplength - mean(puplength)
XY <- centerAge * centerLength
XX <- centerAge^2
Note that the sum of XY terms refers to \(\sum_{i=1}^n (X_i-\bar{X})(Y_i-\bar{Y})\). We will call this sum SXY. Also, the sum of XX terms refers to \(\sum_{i=1}^n (X_i-\bar{X})^2\). We will call this sum SXX.
What is the value of SXY?
What is the value of SXX?
What is the estimated slope using SXY and SXX?
What is the estimated intercept using SXY and SXX?
Fit the regression line using the
lm()function like from the tutorial portion of the lab. Do you get the same estimated intercept and slope using this function as you got the previous questions.
9.2.3 Fitting the Reverse Regression
Fit the reverse regression using the lm() function.
reg.age.len <- lm(pupage ~ puplength)What is the estimated intercept?
What is the estimated slope?
What is the intercept if you do the algebra to put length on the y-axis and age on the x-axis?
What is the slope if you do the algebra to put length on the y-axis and age on the x-axis?
When you finish, your plot should look like this:
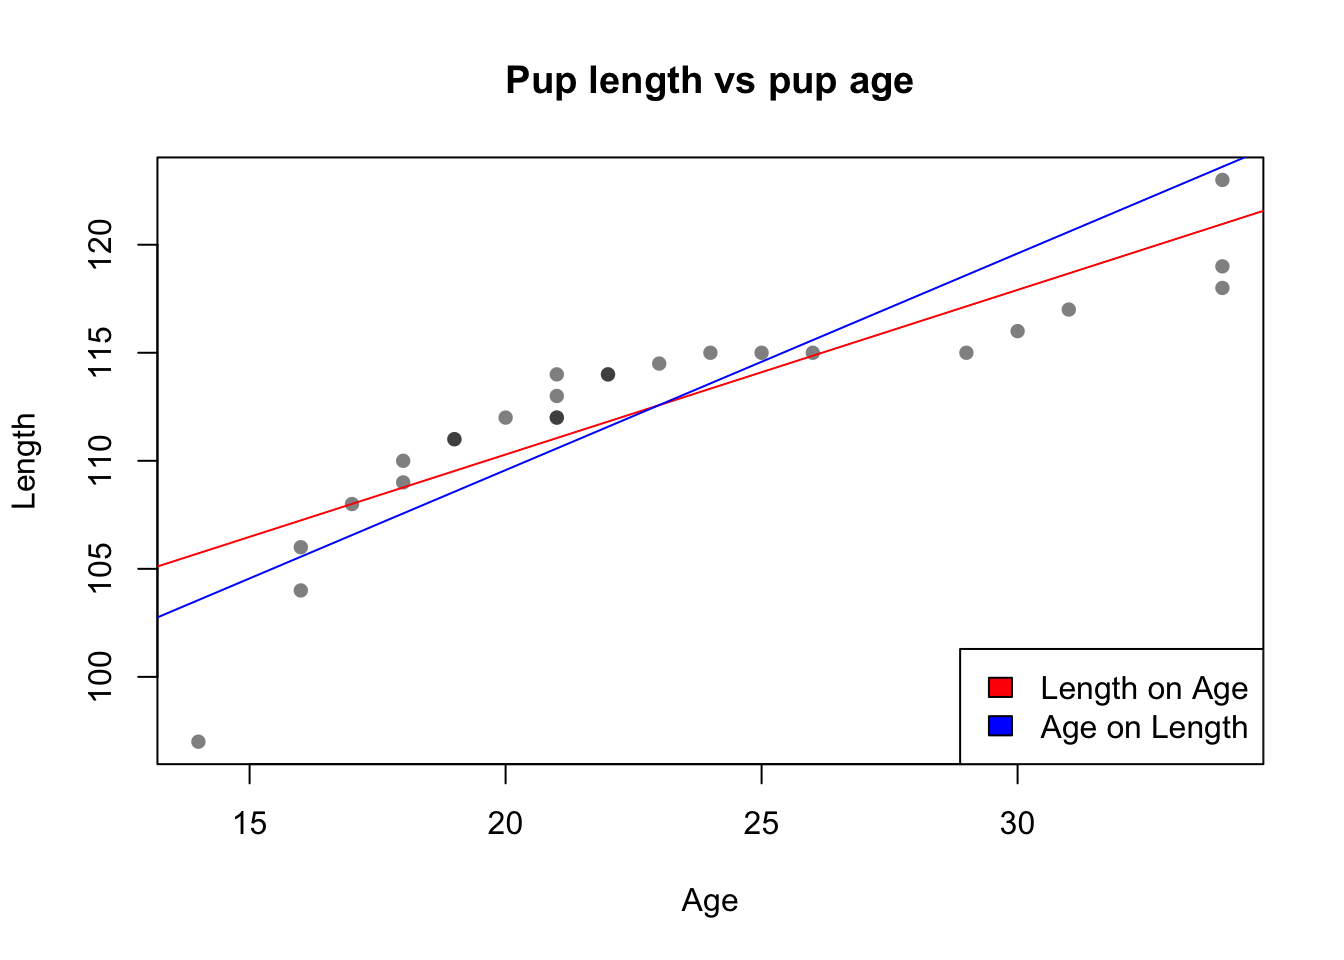
Which statement about the two regression lines is true? Select one:
- They are always different because the roles of X and Y are flipped
- They coincide on the plot if |r(x,y)| = 1
- They are mirror images because b(x|y) = 1/b(y|x)
- They coincide on the plot if r(x,y) = 0
- They are always different because r(x,y) is not equal to r(y,x)
9.2.4 Adding a New Point
Let’s add a new observation (Age = \(\bar{Age}\), Length = 105) to the dataset. Run the following code to do this:
puplength.new = c(puplength, 105)
pupage.new = c(pupage, mean(pupage))
plot(puplength.new ~ pupage.new,
     main = "Pup length vs pup age", xlab = "Age", ylab = "Length",
     pch = 16, col = rgb(0, 0, 0, 0.5))
points(x = mean(pupage), y = 105, col='red', pch = 20)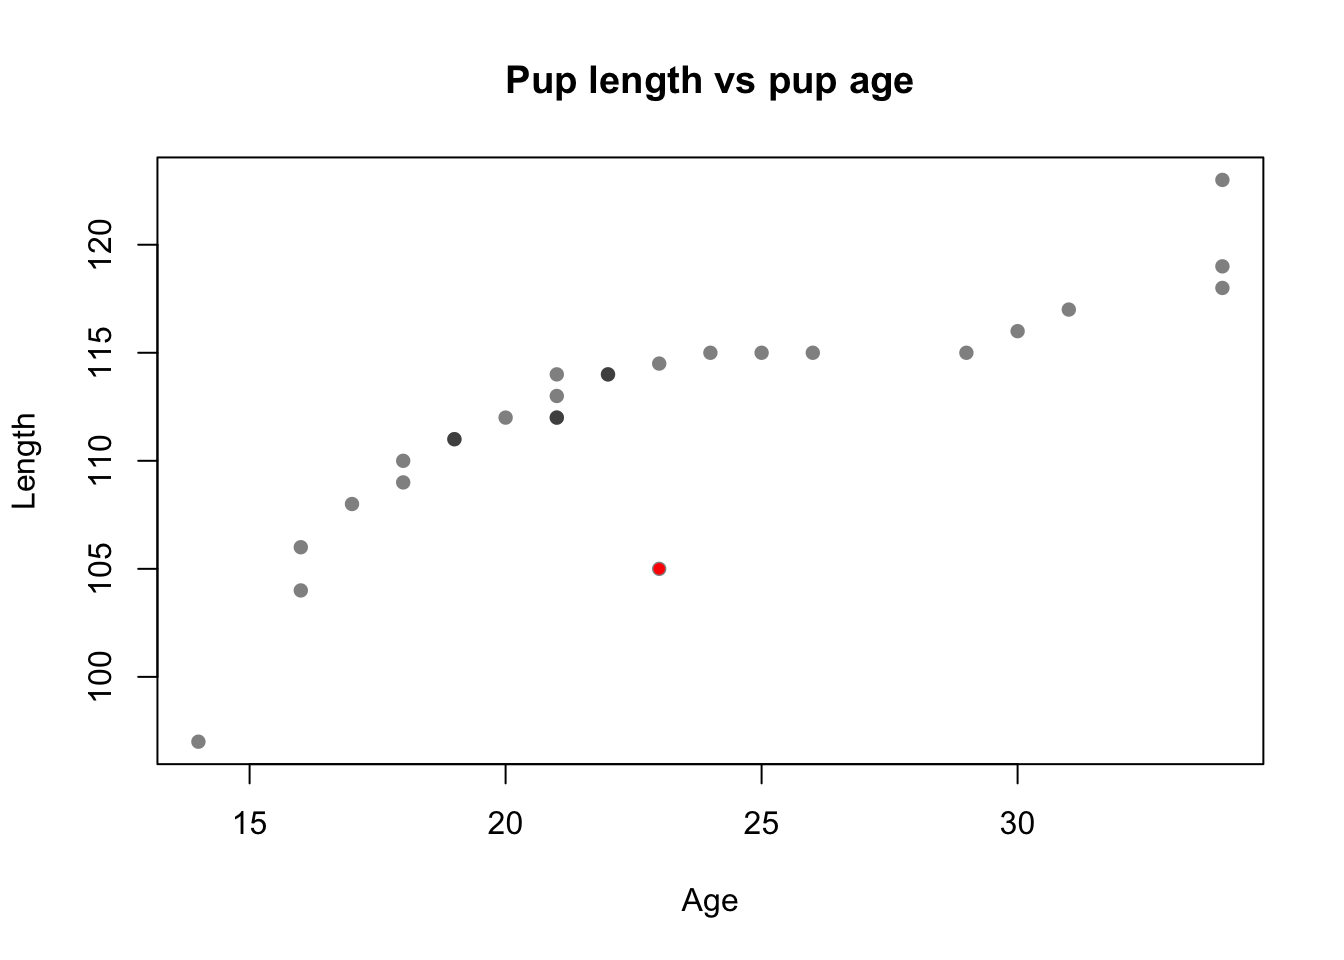
Use the lm() function to fit the regression of length on age. Remember to use the variables puplength.new and pupage.new.
reg.len.age.new <- lm(puplength.new ~ pupage.new)What is the estimated intercept?
What is the estimated slope?
What would you call this new point with respect to the regression of length on age? Select one:
- The centroid
- A high leverage point
- An outlier in the joint distribution
- An influential point
Now use the lm() function again to fit the reverse regression, or the regression of Age on Length.
What is the estimated intercept?
What is the estimated slope?
What would you call this new point with respect to this reverse regression of age on length? Select one:
- An outlier in the Length distribution
- The centroid
- An outlier in the Age distribution
- An influential point