9.6 Confidence Intervals and Hypothesis Tests
Learning Objectives
- Practice calculating confidence intervals.
- Practice performing hypothesis tests.
- Practice calculating the power of a hypothesis test.
Useful Functions
- Use
BSDA::z.test()$conf.intto calculate confidence intervals using the Z-statistic. - Use
t.test()$conf.intto calculate confidence intervals using the t-statistic, - Use
asbio::power.z.test()to calculate the power of a Z-test versus a specific alternative.
Dataset: Weather Data
In this assignment we will look at 4 years of monthly weather data. Download the dataset or copy the dataset’s URL here: weatherData_lab6.csv.
Note: This code as written will only work if you download the dataset to your working directory. You can also replace weatherData_lab6.csv with the URL above.
weatherData <- readr::read_csv('weatherData_lab6.csv')
weatherData
## # A tibble: 54 × 6
## DATE Year Month RainDays MaxTemp MinTemp
## <int> <int> <int> <int> <int> <int>
## 1 19940301 1994 3 0 133 91
## 2 19940401 1994 4 0 159 118
## 3 19940501 1994 5 0 198 150
## 4 19940601 1994 6 0 210 159
## 5 19940701 1994 7 0 260 205
## 6 19940801 1994 8 0 255 200
## 7 19940901 1994 9 0 221 180
## 8 19941001 1994 10 0 163 124
## 9 19941101 1994 11 1 93 61
## 10 19941201 1994 12 4 87 58
## # ... with 44 more rowsFor most of this assignment, we will focus on the MaxTemp variable. This represents the maximum temperature observed each month. Note that the MaxTemp data are given in degrees Celsius x 10, so we scale it back down to degrees Celsius by dividing by 10 below.
MaxTemp <- weatherData$MaxTemp / 10
Month <- weatherData$Month
Let us look at the data first.
par(mfrow = c(1, 3), omi = c(0, 0, .3, 0))
boxplot(MaxTemp, ylab = "Maximum Temperature", main = "Box plot")
hist(MaxTemp, freq = FALSE, col = "steelblue",
     xlab = "Maximum Temperature", main = "Histogram")
mtext("Maximum Temperature Distribution", outer = TRUE, side = 3, line = -1)
plot(Month, MaxTemp, col = rgb(0, 0.4, 0, 0.5), pch = 16,
     xlab = "Month Number in Year", ylab = "Maximum Temperature", main="Time Trend")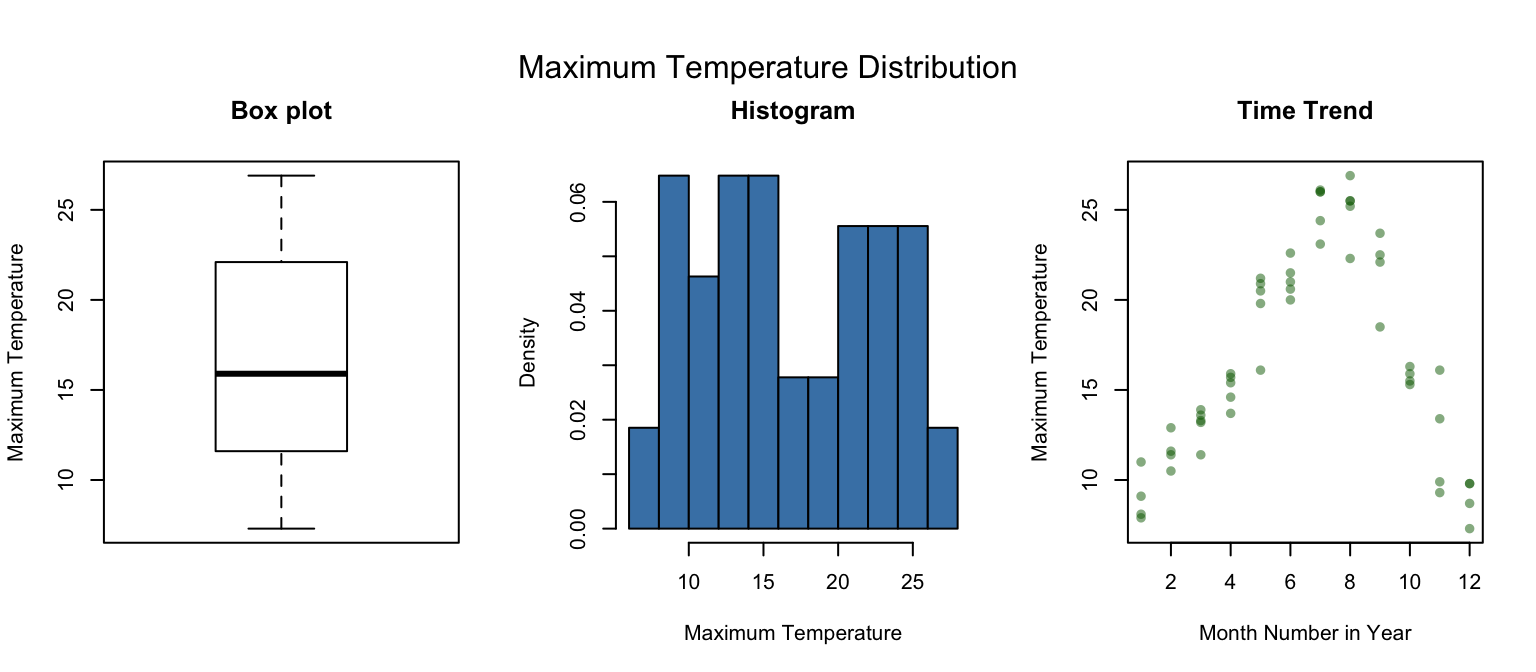
summary(MaxTemp)## Min. 1st Qu. Median Mean 3rd Qu. Max.
## 7.30 11.92 15.90 16.90 21.95 26.909.6.1 Confidence intervals and hypothesis tests for means
- How many observations are in your sample?
Calculate a 95% confidence interval for the population mean of the MaxTemp variable \(\mu\) using a t-interval.
What is the lower bound of this t-interval?
What is the upper bound of this t-interval?
Calculate a 95% confidence interval for the population mean of the MaxTemp variable \(\mu\) using a Z-interval, assuming that the population standard deviation is the same as the sample standard deviation.
What is the lower bound of this Z-interval?
What is the upper bound of this Z-interval?
Calculate a 95% confidence interval for the population mean of the MaxTemp variable \(\mu\) using the empirical rule (recall the empirical rule tells us that 95% probability is within 2 standard deviations of the mean of a Normal distribution).
What is the lower bound of this empirical interval?
What is the upper bound of this empirical interval?
Which one of the following statements are correct about the two intervals you have calculated?
- The t-interval should not be used since the observations are not normally or symmetrically distributed.
- The Z-interval should not be used since the observations are not normally distributed.
- The Z-interval and t-interval are very close, the resulting confidence intervals are nearly identical.
- Neither should be used since the sample distribution of max temp is bimodal.
- The t-interval should not be used since the observations are not normally or symmetrically distributed.
Find and report the test statistic you would use to conduct a Z-test at level 0.05 for \(H_0: \mu = 15\) versus \(H_A: \mu > 15\). (Here, assume that the sample standard deviation is equal to the population standard deviation).
What is the one-tailed p-value for the test statistic in the N(0,1) distribution? (round to three decimal places)
What decision would you make based on the Z-test if you were willing to accept a type 1 error rate of 5%?
- Accept the null hypothesis.
- Reject the null hypothesis.
- The test is wrong.
- The test is indecisive.
Find and report the test statistic you would use to conduct a t-test at level 0.05 for \(H_0: \mu = 15\) versus \(H_A: \mu > 15\).
What is the one-tailed p-value for the test statistic in the t-distribution. (round to three decimal places)
What decision would you make based on the t-test if you were willing to accept a type 1 error rate of 5%?
- Accept the null hypothesis.
- Reject the null hypothesis.
- The test is wrong.
- The test is indecisive.
- Accept the null hypothesis.
Which test should be used?
- t-test should not be used since sample size is not large enough.
- Z-test should not be used since the observations are not normal.
- p-values are very close, the results of both tests will be almost identical.
- Neither should be used since the observations are not normal.
- t-test should not be used since sample size is not large enough.
What is the Z-value that defines the upper bound of the Z-interval in question 1.5?
What is the critical Z-value used for the one-tailed Z-test in question 1.9?
Referring back to your test statistic in 1.9, what can you conclude by comparing the results of the 95% Z-interval and the level 0.05 Z-test about whether the true mean is equal to 15?
- The Z-interval is incorrect since it contains the mean but the test rejects the null hypothesis.
- The Z-test is incorrect because it rejects the null hypothesis even though the Z-interval contains the mean.
- Both of them are correct but they give different results because Z-intervals are two sided and symmetric, while the Z-test here is one sided.
- None of the above.
9.6.2 Power Calculations
Now suppose we want to find the power of a hypothesis test against a specific alternative hypothesis. For this problem, assume the population standard deviation \(\sigma\) is same as the sample standard deviation sd(MaxTemp), so we can use a Z-test.
Consider testing \(H_0:\mu=15\) versus \(H_a:\mu>15\) at level 0.05.
Calculate the power of the Z-test against \(H_A:\mu=16\).
Now suppose you want to test against a different alternative: \(H_A:\mu=18\). Calculate the power of the Z-test against this alternative.
Finally, suppose your sample size is reduced to 15 observations, but the sample standard deviation,
sd(MaxTemp), is unchanged. Calculate the power of the test against \(H_A:\mu=16\) for this smaller sample.Which one of the following is correct:
- Power increases with sample size.
- Power increases as the difference between the truth and the null increases.
- Both larger sample size and larger differences between the truth and the null increase the power of a test.
- None of the above.