4.1 Two-Way Tables
Previously, we considered how to tabulate one categorical variable (into a one-dimensional table). Now we consider a table with two categorical variables, resulting in a two-dimensional table, also called a matrix or a two-dimensional array.
4.1.1 Matrices
You can create a matrix with the matrix() function. Unfortunately, the syntax is somewhat unintuitive. You must supply all of the values in a vector, along with the number of rows or columns, like so,
matrix(1:6, nrow = 3)## [,1] [,2]
## [1,] 1 4
## [2,] 2 5
## [3,] 3 6Notice that the numbers filled in the first column first, which is unintuitive to some people. If you wish to fill in the matrix by rows, you must use the byrow option, like so,
matrix(1:6, nrow = 3, byrow = TRUE)## [,1] [,2]
## [1,] 1 2
## [2,] 3 4
## [3,] 5 6If you want to access a particular element of a matrix, you can use the [] brackets, similar to accessing parts of a vector. For example x[3] is the third element of the vector x, and M[3,4] is the element in the 3rd row, 4th column of the matrix M.
mat = matrix(1:6, nrow = 3, byrow = TRUE)
mat
## [,1] [,2]
## [1,] 1 2
## [2,] 3 4
## [3,] 5 6mat[3,2]## [1] 6You can also access an entire row or column by leaving off the column or row number, respectively.
mat[2,]## [1] 3 4mat[,1]## [1] 1 3 5You can flip, or transpose, a matrix using the t() function.
t(mat)## [,1] [,2] [,3]
## [1,] 1 3 5
## [2,] 2 4 64.1.2 Example Dataset
Let’s say a drug company is interested in evaluating the performance of two new drugs in development, New Drug 1 (D1) and New Drug 2 (D2), in alleviating Disease Y symptoms. They want to test it against the current standard drug (ST). They enroll 1000 people in a large clinical trial, and found that:
- out of the 400 people put on D1, 200 found their health status improve,
- out of the 200 people put on D2, 150 found their health status improve, and
- out of the 400 people put on ST, 240 found their health status improve.
You can create the table directly in R:
drug <- matrix(c(200, 200, 150, 50, 240, 160), ncol = 2, byrow = TRUE)
colnames(drug) <- c("Improved", "NotImproved")
rownames(drug) <- c("D1", "D2", "ST")
#drug <- as.table(drug)
drug
## Improved NotImproved
## D1 200 200
## D2 150 50
## ST 240 1604.1.3 Working with Two-Way Tables
Here we look at some of the commands available to help look at the information in a table in different ways. First, there are a couple of ways to get graphical views of the data:
barplot(drug, legend=TRUE, beside=TRUE,
        main='Health Improvement by Drug Treatment (bar plot)')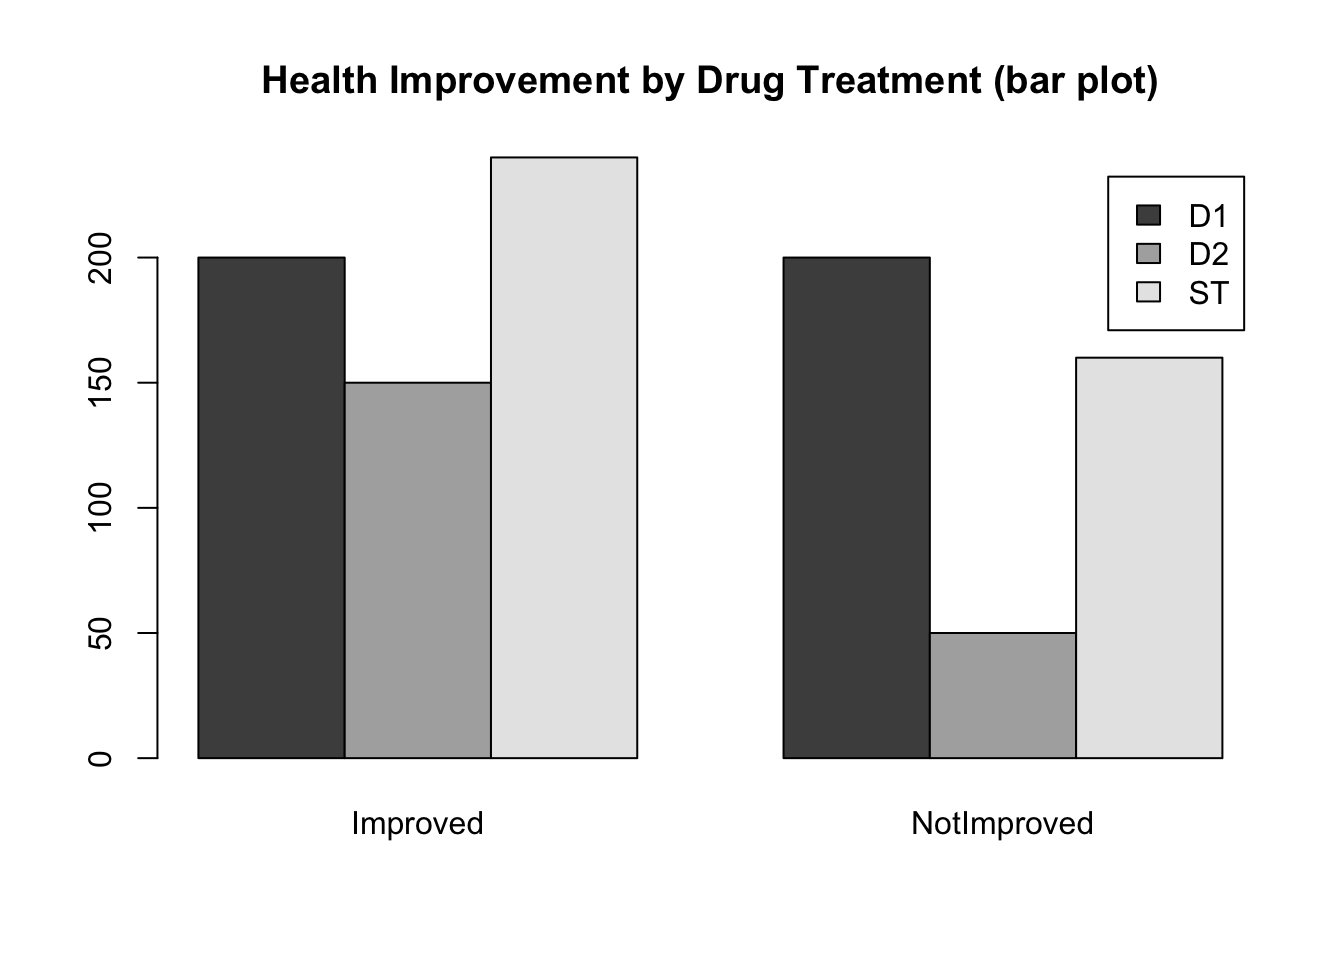
barplot(t(drug), legend=TRUE, beside=FALSE,
        main='Drug Treatment by Health Improvement (bar plot)',
        args.legend = list(x="top"))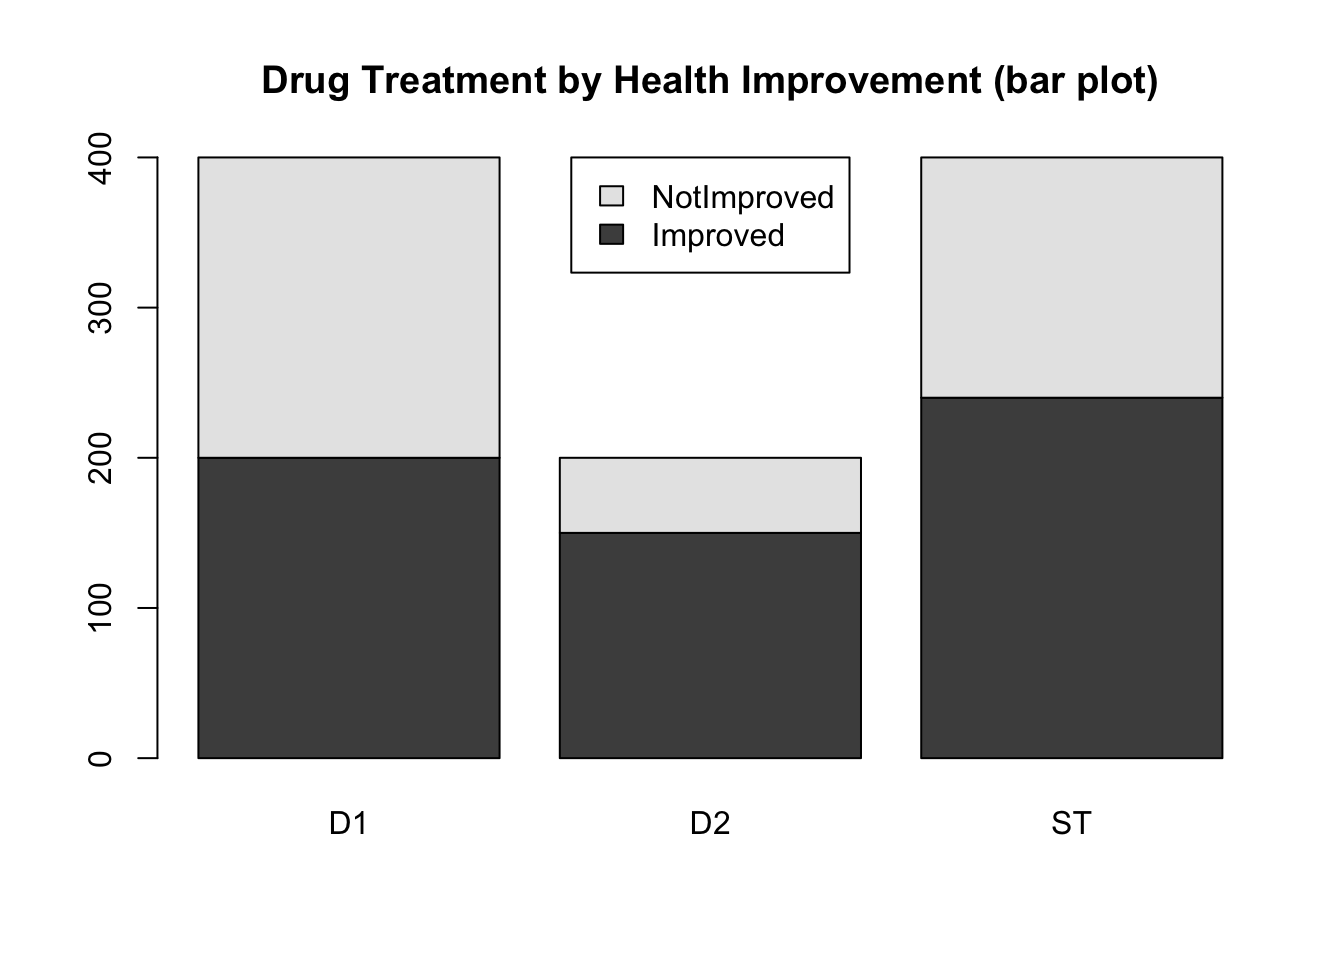
mosaicplot(drug, main="Health Improvement by Drug Treatment (mosaic plot)")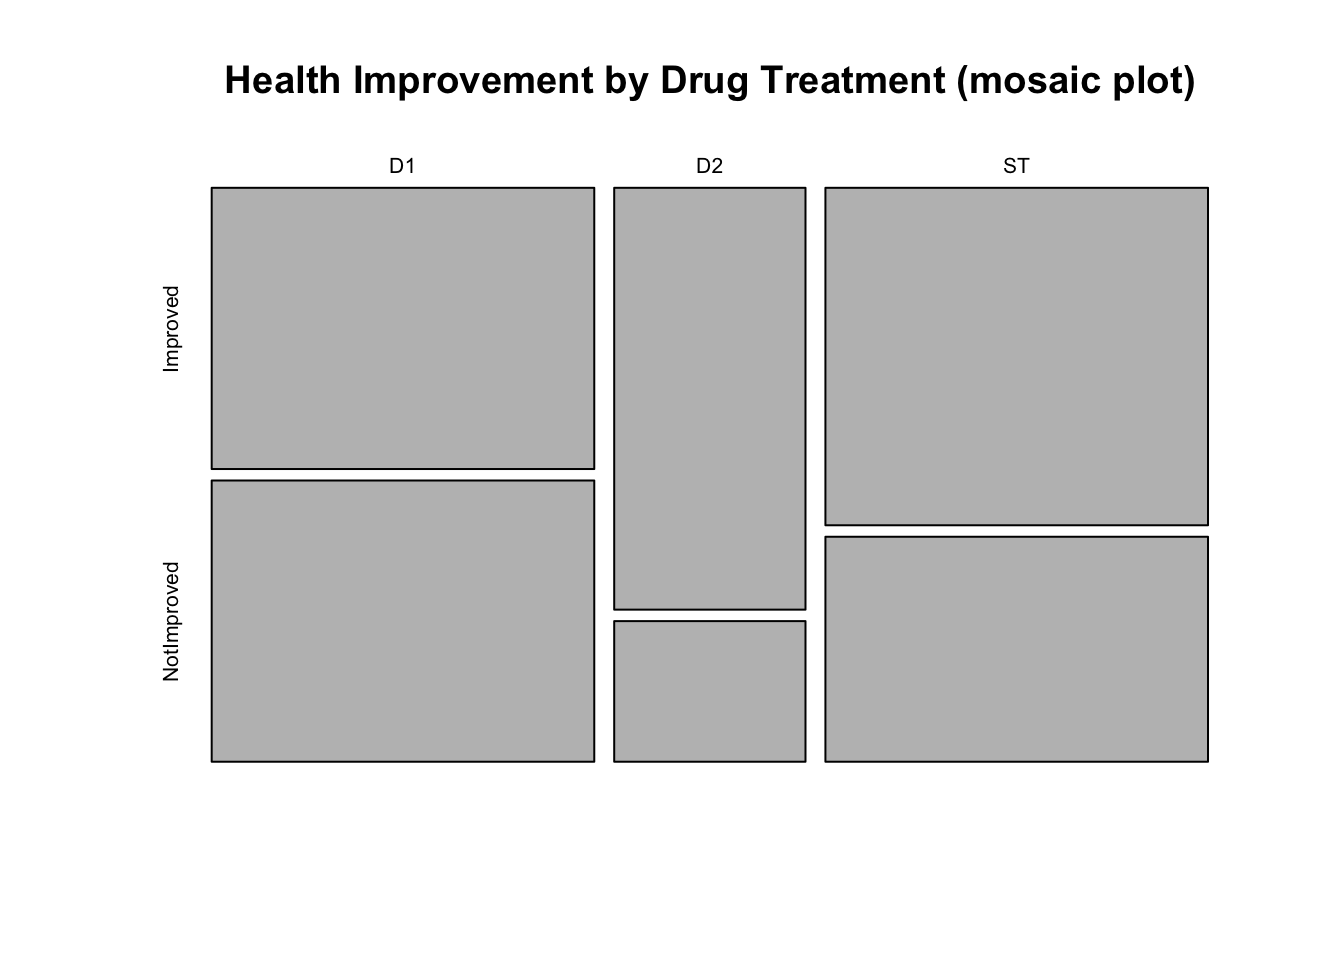
Discussion
- What questions might you be able to answer with the first graph? What questions might you be able to answer with the second graph?
- Which display is most informative? Why?
4.1.4 Distributions in Two-Way Tables
There are a number of ways to get marginal distributions using the margin.table() function. If you pass just the table (the first argument) to the command it calculates the total number of observations.
margin.table(drug)## [1] 1000If you pass it the optional second argument margin, it will calculate the marginal frequencies. We use margin = 1 for the row margins,
margin.table(drug, margin = 1)## D1 D2 ST
## 400 200 400And we use margin = 2 for the column margins,
margin.table(drug, margin = 2)## Improved NotImproved
## 590 410You can get a table of the joint proportions with prop.table(),
prop.table(drug)## Improved NotImproved
## D1 0.20 0.20
## D2 0.15 0.05
## ST 0.24 0.16To calculate conditional probabilities, margin can be specified similarly to margin.table(). We can calculate P(Health Improvement|Drug) by using margin = 1.
prop.table(drug, margin = 1)## Improved NotImproved
## D1 0.50 0.50
## D2 0.75 0.25
## ST 0.60 0.40We can calculate P(Drug|Health Improvement) by using margin = 2.
prop.table(drug, margin = 2)## Improved NotImproved
## D1 0.3389831 0.4878049
## D2 0.2542373 0.1219512
## ST 0.4067797 0.3902439So, how well do you think the new treatment drug candidates perform relative to the standard treatment?
4.1.5 Chi-squared Test
We can test for dependence between the row and column variables, using Pearson’s chi-squared test. We can perform the chi-squared test very easily using the chisq.test() function.
chisq.test(drug)##
## Pearson's Chi-squared test
##
## data: drug
## X-squared = 34.725, df = 2, p-value = 2.881e-08We can also access the expected counts that chisq.test() calculates automatically.
chisq.test(drug)$expected## Improved NotImproved
## D1 236 164
## D2 118 82
## ST 236 1644.1.6 Exercises
Using your new R capabilities, check the answers you found above using R:
- What is the marginal distribution of subjects who improved/did not improve?
- What is the marginal distribution of drug assignments?
- What is the conditional distribution of subjects who improved given that they received drug D2?
- Amoung subjects who improved, what proportion received D1?
- What is the joint proportion of subjects who improved and received the standard drug?
- What proportion of all subjects received drug D2 and did not improve?
- If there is no association between improvement and drug choice, how many of the subjects which took drug D1 would you expect to improve?
- What is the conditional distribution of improvement given drug received? What drug seems to be working the best? worst?