Example Dataset: Theo’s Chocolate Bars
Let’s say we are asked to evaluate some chocolate bar data from Theo’s (a local Seattle chocolate maker). They have measured the weight (in grams) of 10000 chocolate bars and would like us to help them understand and summarize the variability in their production process. We will simulate the data (from a Normal distribution with \(\mu = 40\) and \(\sigma = 2\)). We know the true mean and variance of the chocolate bar weights, but at various points in the tutorial we may assume these parameters are unknown.
set.seed(1)
choc <- rnorm(10000, mean = 40, sd = 2)
As a good habit, we examine our data before proceeding.
hist(choc, freq = FALSE, main = "Chocolate Bar Histogram", xlab = "Weight")
curve(dnorm(x, mean = 40, sd = 2), col = "blue", add = TRUE)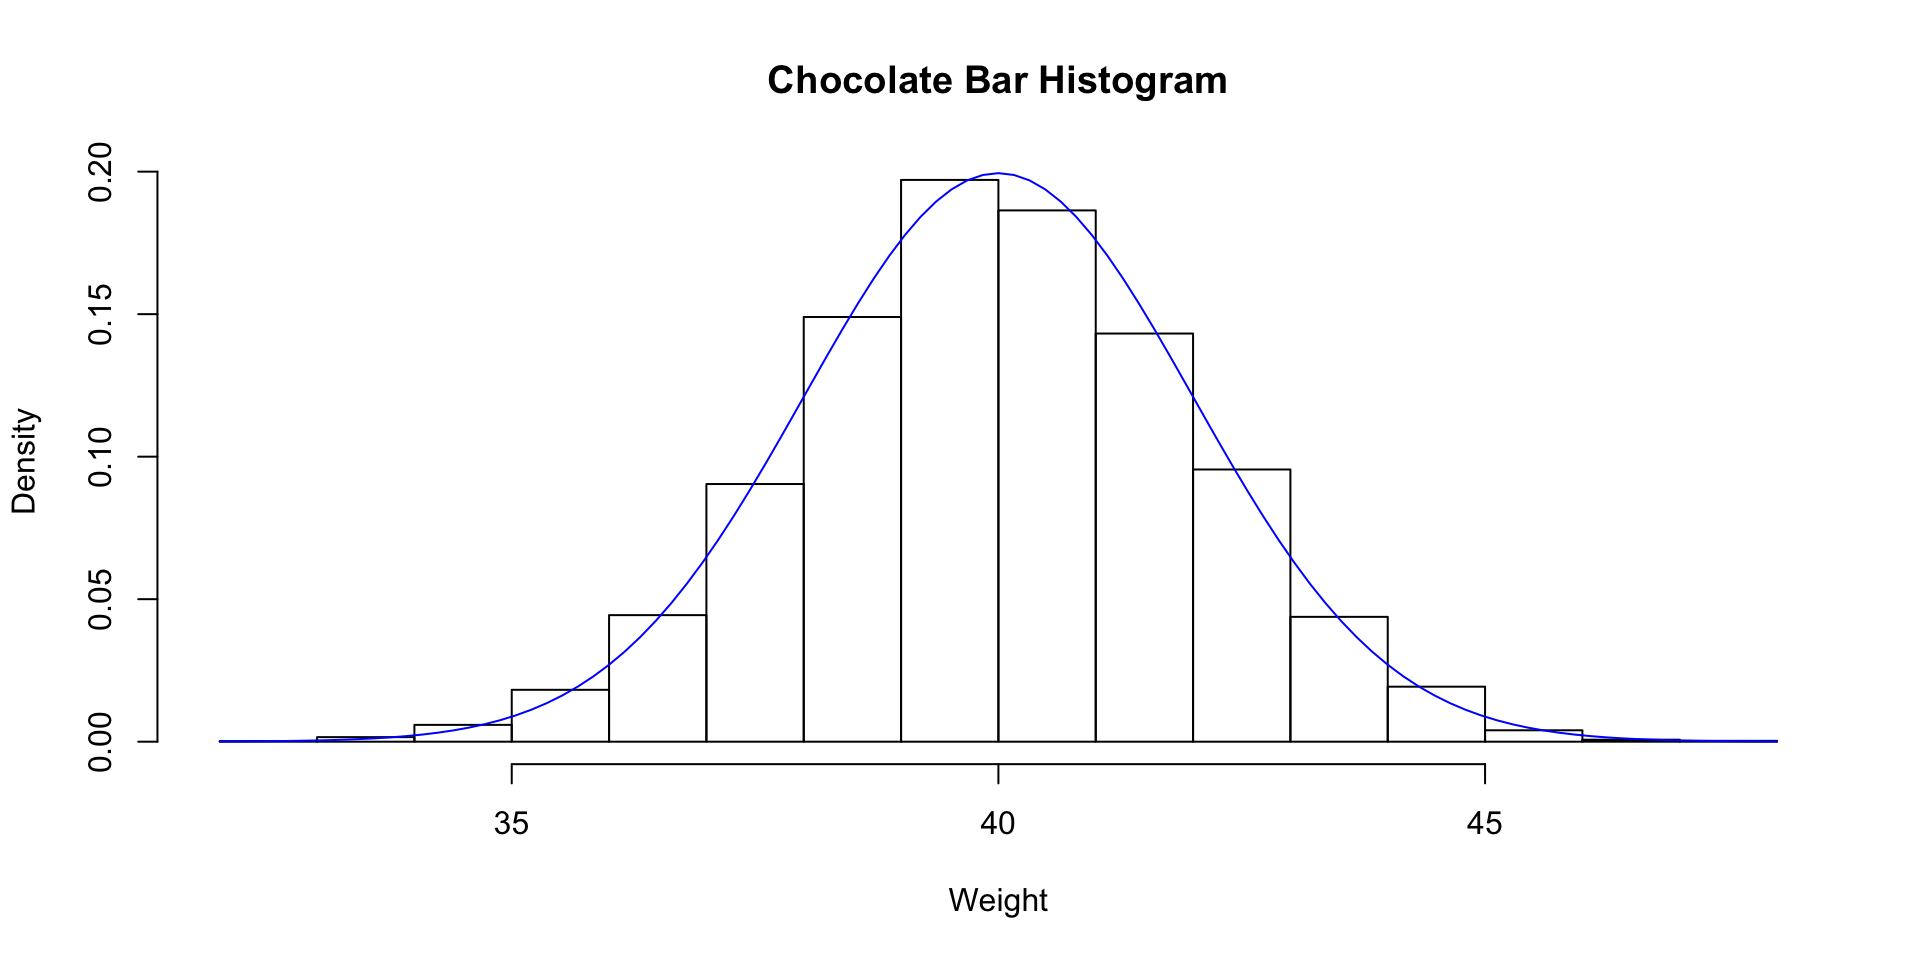
summary(choc)## Min. 1st Qu. Median Mean 3rd Qu. Max.
## 32.66 38.65 39.97 39.99 41.36 47.62